See how p-Value is Determined When Testing a Null Hypothesis: Step by step Procedures
When you test a hypothesis about a population, you can use your test statistic to decide whether to reject the null hypothesis, H0. You make this decision by coming up with a number, called a p-value.
A p-value is a probability associated with your critical value. The critical value depends on the probability you are allowing for a Type I error. It measures the chance of getting results at least as strong as yours if the claim (H0) were true.
See the figure below showing locations of a test statistic and their corresponding conclusions.
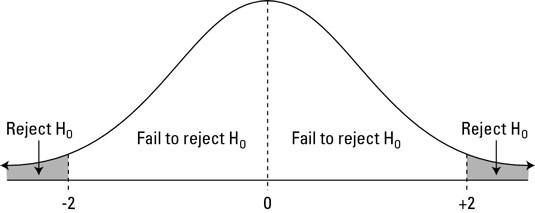
Decisions for Ha: not-equal-to.
Note that if the alternative hypothesis is the less-than alternative, you reject H0 only if the test statistic falls in the left tail of the distribution (below –2). Similarly, if Ha is the greater-than alternative, you reject H0 only if the test statistic falls in the right tail (above 2).
To find the p-value for your test statistic:
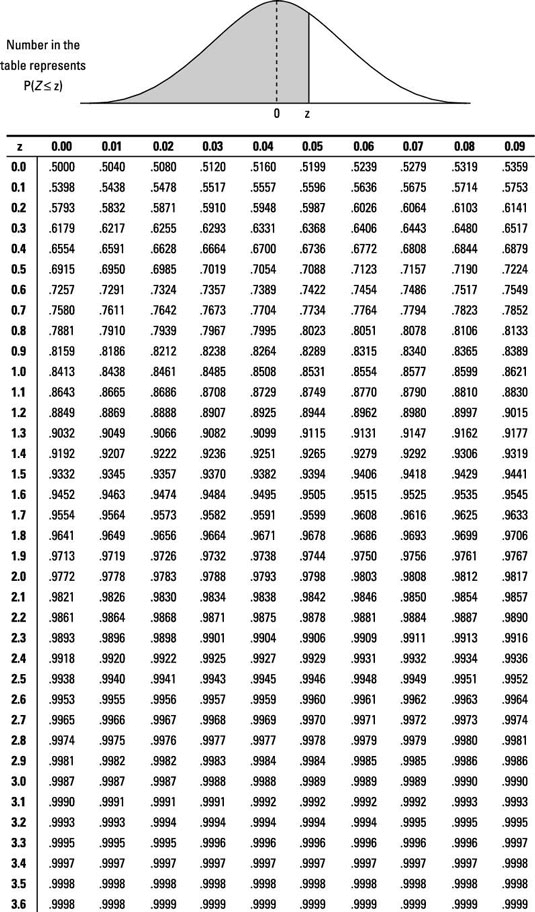
>> Look up your test statistic on the appropriate distribution — in this case, on the standard normal (Z-) distribution (see the following Z-tables).

>>Find the probability that Z is beyond (more extreme than) your test statistic:
>>If Ha contains a less-than alternative, find the probability that Z is less than your test statistic (that is, look up your test statistic on the Z-table and find its corresponding probability). This is the p-value. (Note: In this case, your test statistic is usually negative.)
>> If Ha contains a greater-than alternative, find the probability that Z is greater than your test statistic (look up your test statistic on the Z-table, find its corresponding probability, and subtract it from one). The result is your p-value. (Note: In this case, your test statistic is usually positive.)
>> If Ha contains a not-equal-to alternative, find the probability that Z is beyond your test statistic and double it. There are two cases:
>> If your test statistic is negative, first find the probability that Z is less than your test statistic (look up your test statistic on the Z-table and find its corresponding probability). Then double this probability to get the p-value.
>> If your test statistic is positive, first find the probability that Z is greater than your test statistic (look up your test statistic on the Z-table, find its corresponding probability, and subtract it from one). Then double this result to get the p-value.
Suppose you are testing a claim that the percentage of all women with varicose veins is 25%, and your sample of 100 women has 20% who have varicose veins. Then the sample ratio p = 0.20. The standard error of your sample ratio is the square root of p(1-p)/n which is 0.04 or 4%. You can find the test statistic by taking the proportion in the sample with varicose veins, 0.20, subtracting the claimed proportion of all women with varicose veins, 0.25, and then dividing the result by the standard error, 0.04. These calculations give you a statistical test (standard score) -0.05 divided by 0.04 = -1.25. This tells you that your sample results and the population claim at H0 are 1.25 standard error; In particular, your sample results are 1.25 standard error less than the claim.
When testing H0: p = 0.25 against Ha: p < 0.25, you find that the p-value is -1.25 by finding the probability that Z is less than -1.25. When you look at this number in the table Z above, you find that the probability of 0.1056 of Z is less than this value.
Important: If you had been testing the two-sided alternative,
![]()
the p-value would be 2 ∗ 0.1056, or 0.2112.
“If the results are likely to have occurred under the claim, then you fail to reject H0 (like a jury decides not guilty). If the results are unlikely to have occurred under the claim, then you reject H0 (like a jury decides guilty).”