How to Use the Resource Monitor in Windows 7
If you’re having trouble with a program taking over your PC, slowing things down, or even locking things up, you can use the reliability data available in Windows 7 Resource Monitor to see what’s going on inside your PC. The Resource Monitor knows everything, sees everything, and tells everyone (with an abundance of graphs and statistics).
- Choose Start → All Programs → Accessories → System Tools → Resource Monitor.
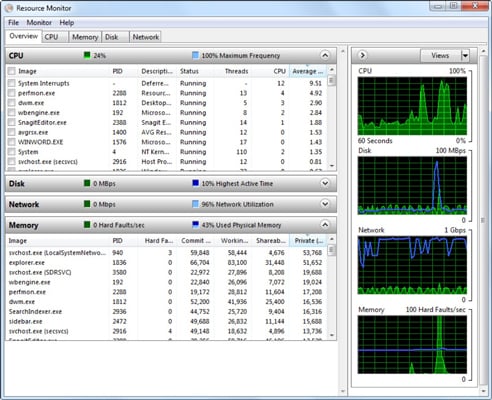
The Windows 7 Resource Monitor appears, in its Overview state.
To get there quickly, click Start, type resmon, and hit Enter.
- To see which programs are hogging the CPU, click the Average CPU column heading.
That column presents a 60-second running average of CPU utilization. The hogs float to the top.
If a program has stopped responding, right-click it here and choose Analyze Process. You may be able to glean some worthwhile information that helps you whack the program upside the head.
- Click the Memory tab to see how your computer’s memory is being used.
The bar graph at the bottom of the figure may surprise you. For example, if you have 4GB installed on a 32-bit Windows 7 system, a sizable chunk of memory isn’t accessible.
In general, if Windows reports many page faults (the graph marked Hard Faults/sec), you may be able to increase your computer’s performance significantly by increasing the amount of memory available.
- When you’re done, click the X Close button to close the Resource Monitor.